Download \(CO_2\) emissions per capita from [Our World In Data] https://ourworldindata.org/co2/country/united-states?country=~USA#per-capita-how-much-co2-does-the-average-person-emit
file_csv <- here("_posts",
                 "2021-03-02-reading-and-writing-data",
                 "co-emissions-per-capita.csv")
emissions <- read_csv(file_csv)
emissions
# A tibble: 22,383 x 4
   Entity      Code   Year `Per capita CO2 emissions`
   <chr>       <chr> <dbl>                      <dbl>
 1 Afghanistan AFG    1949                    0.00191
 2 Afghanistan AFG    1950                    0.0109
 3 Afghanistan AFG    1951                    0.0117
 4 Afghanistan AFG    1952                    0.0115
 5 Afghanistan AFG    1953                    0.0132
 6 Afghanistan AFG    1954                    0.0130
 7 Afghanistan AFG    1955                    0.0186
 8 Afghanistan AFG    1956                    0.0218
 9 Afghanistan AFG    1957                    0.0343
10 Afghanistan AFG    1958                    0.0380
# … with 22,373 more rows
tidy_emissions <- emissions %>%
clean_names()
tidy_emissions
# A tibble: 22,383 x 4
   entity      code   year per_capita_co2_emissions
   <chr>       <chr> <dbl>                    <dbl>
 1 Afghanistan AFG    1949                  0.00191
 2 Afghanistan AFG    1950                  0.0109
 3 Afghanistan AFG    1951                  0.0117
 4 Afghanistan AFG    1952                  0.0115
 5 Afghanistan AFG    1953                  0.0132
 6 Afghanistan AFG    1954                  0.0130
 7 Afghanistan AFG    1955                  0.0186
 8 Afghanistan AFG    1956                  0.0218
 9 Afghanistan AFG    1957                  0.0343
10 Afghanistan AFG    1958                  0.0380
# … with 22,373 more rows| Name | Piped data |
| Number of rows | 219 |
| Number of columns | 4 |
| _______________________ | |
| Column type frequency: | |
| character | 2 |
| numeric | 2 |
| ________________________ | |
| Group variables | None |
Variable type: character
| skim_variable | n_missing | complete_rate | min | max | empty | n_unique | whitespace |
|---|---|---|---|---|---|---|---|
| entity | 0 | 1.00 | 4 | 32 | 0 | 219 | 0 |
| code | 12 | 0.95 | 3 | 8 | 0 | 207 | 0 |
Variable type: numeric
| skim_variable | n_missing | complete_rate | mean | sd | p0 | p25 | p50 | p75 | p100 | hist |
|---|---|---|---|---|---|---|---|---|---|---|
| year | 0 | 1 | 1994.00 | 0.00 | 1994.00 | 1994.00 | 1994.00 | 1994.00 | 1994.00 | ▁▁▇▁▁ |
| per_capita_co2_emissions | 0 | 1 | 4.89 | 6.82 | 0.02 | 0.56 | 2.66 | 7.26 | 60.56 | ▇▁▁▁▁ |
# A tibble: 12 x 4
   entity                     code   year per_capita_co2_emissions
   <chr>                      <chr> <dbl>                    <dbl>
 1 Africa                     <NA>   1994                     1.04
 2 Asia                       <NA>   1994                     2.27
 3 Asia (excl. China & India) <NA>   1994                     3.23
 4 EU-27                      <NA>   1994                     8.48
 5 EU-28                      <NA>   1994                     8.66
 6 Europe                     <NA>   1994                     8.87
 7 Europe (excl. EU-27)       <NA>   1994                     9.36
 8 Europe (excl. EU-28)       <NA>   1994                     9.22
 9 North America              <NA>   1994                    14.1
10 North America (excl. USA)  <NA>   1994                     4.98
11 Oceania                    <NA>   1994                    11.5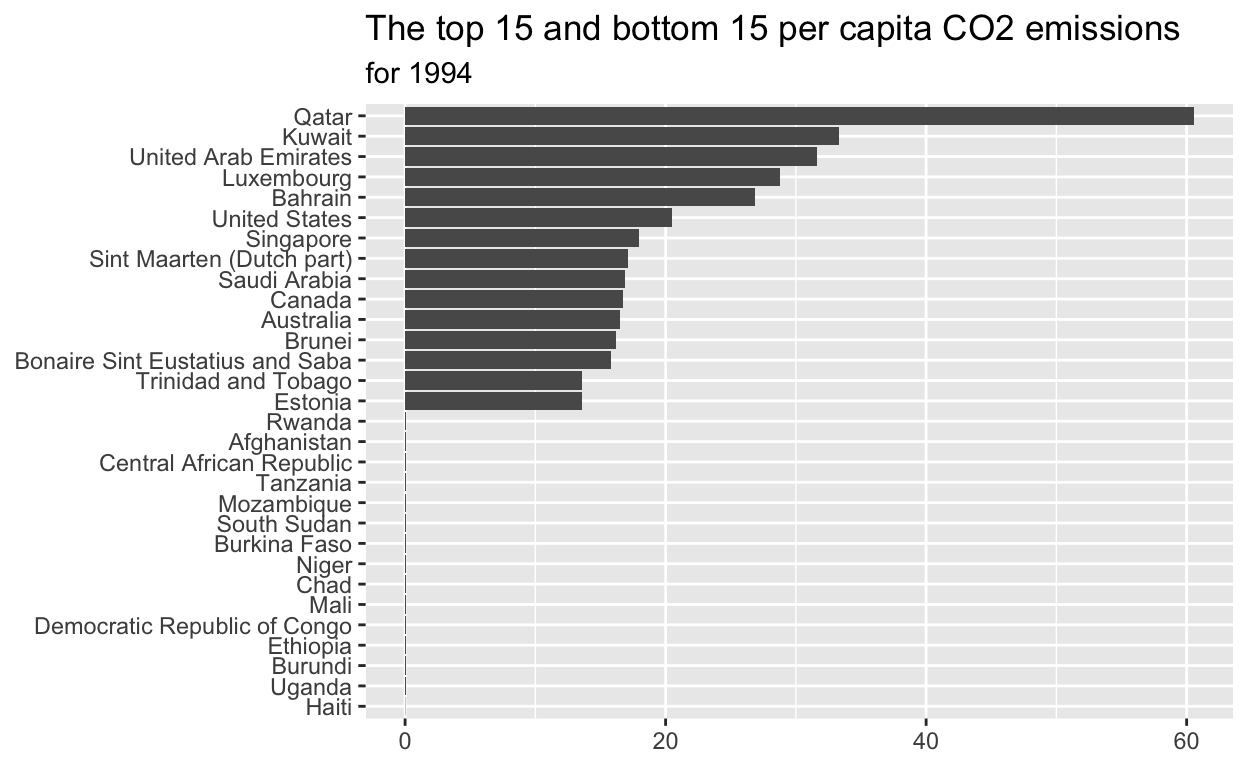
12 South America <NA> 1994 2.06max_15_emitters <- emissions_1994 %>%
slice_max(per_capita_co2_emissions, n=15)
min_15_emitters <- emissions_1994 %>%
  slice_min(per_capita_co2_emissions, n=15)
max_min_15 <- bind_rows(max_15_emitters, min_15_emitters)
max_min_15 %>% write_csv("max_min_15.csv")
max_min_15 %>% write_tsv("max_min_15.tsv")
max_min_15 %>% write_delim("max_min_15.psv", delim = "|")
max_min_15_csv <-  read_csv("max_min_15.csv")
max_min_15_tsv <-  read_tsv("max_min_15.tsv")
max_min_15_psv <-  read_delim("max_min_15.psv", delim ="|")
setdiff(max_min_15_csv,max_min_15_tsv,max_min_15_psv)
# A tibble: 0 x 3
# … with 3 variables: country <chr>, code <chr>,
#   per_capita_co2_emissions <dbl>
max_min_15_plot_data <- max_min_15 %>%
mutate(country = reorder(country, per_capita_co2_emissions))
ggplot(data = max_min_15_plot_data,
       mapping = aes(x=per_capita_co2_emissions, y=country))+
geom_col()+
labs(title = "The top 15 and bottom 15 per capita CO2 emissions",
     subtitle = "for 1994",
     x = NULL,
     y = NULL)
ggsave(filename="preview.png",
    path = here("_posts", "2021-03-02-reading-and-writing-data"))
preview: preview.png